Overlay
Economics

After a bruising week, what’s next for UK markets?

Our analysts share their views on how the latest UK policy moves affect the outlook for markets and interest rates.

The dust may not be completely settled yet, but for now, some sense of calm seems to have been restored. Where do we see interest rates, bond yields, and sterling headed from here? We certainly don’t think the UK is embroiled in a full-blown financial crisis, but it is worth considering some important changes to the outlook.

Sterling has taken a hard pounding, but parity with the USD still looks unlikely

We continue to see dollar-parity as a ‘risk case’ rather than a ‘base case’, even if the pound flirts with (and temporarily touches) those levels. We still think that GBP/USD will be closer to 1.10 than parity by year-end.

Sterling’s fundamentals have deteriorated in recent years, most clearly because of a weaker growth outlook and larger current account deficit funding needs. It’s right that the currency is lower after the mini budget on 23 September, and likely to trade lower yet. But we do not believe we have reached ‘crisis’ levels and nor do we expect to.

GBP/USD depends largely on the US

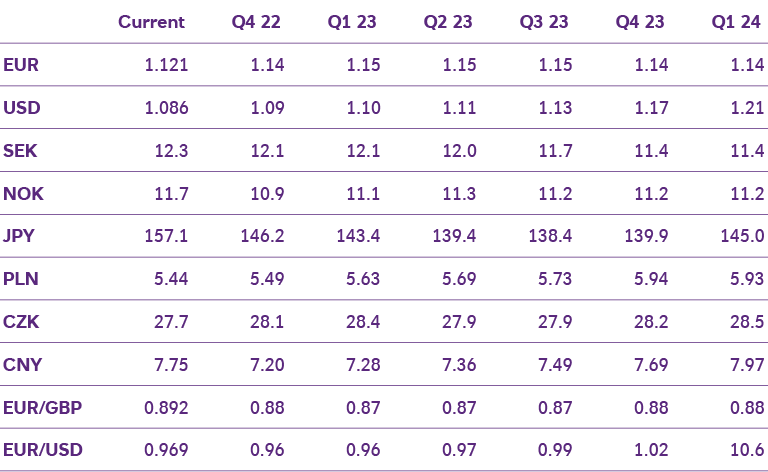
True, sterling has weakened significantly against the US dollar. But it has performed not nearly as poorly against other currencies (see below). That’s largely because the US dollar is trading at multi-decade highs (an issue for a wide range of countries, not just the UK). So, while the GBP/USD exchange rate may be a concern for UK businesses, wider sterling valuations suggest that the situation isn’t as bad many seem to think.

Key FX forecasts

Sources: Bloomberg, NatWest Markets

That said, for the GBP/USD rate, the outlook heavily depends on the US dollar. Picking the timing of a turn in the US dollar’s strength (driven, we think, by relative economic growth) is arguably more important than sterling-specific fundamentals.

EUR/GBP will likely settle back to lower levels

We are less convinced that the recent move higher in EUR/GBP is fully justified as the focus will now shift to the rest of Europe. There are no easy options for governments. Softening German business sentiment, highlighted by September’s Purchasing Manager’s Index (PMI) figures, hints at the region’s precarious position. Further fiscal policy easing in Europe to tackle high energy prices seems all but inevitable.

How high can the Bank Rate go? Not as high as doomsayers think

Whilst UK inflation is sensitive to the exchange rate, it is far from clear that the inflation impulse from sterling’s depreciation warrants the Bank Rate reaching anything like the 6% markets are currently pricing. We think the Bank Rate is more likely to peak at 4.5% in Q1 2023.

How high would rates need to rise? At the time of writing, sterling (trade-weighted) had fallen by around 3% since the mini budget on 23 September 2022 and by 6% since the August 2022 Monetary Policy Report MPR. We estimate that a sustained 3% fall in sterling might reasonably be expected to boost core price inflation by around 0.5% (and a 6% fall by around 1%) a year or so down the line. That’s clearly not helpful for the BoE, but nor does it necessitate the sort of ‘shock-and-awe’ monetary policy being priced in by financial markets.

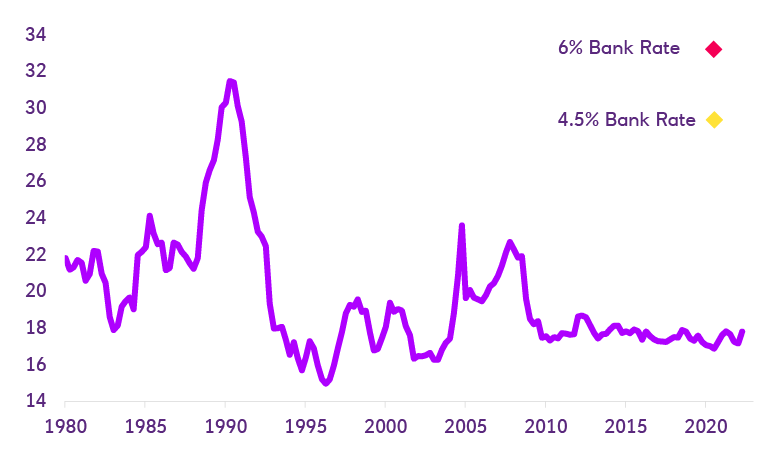
Looking at household debt servicing costs, which currently stand at 17.8% of pre-tax income (historically low levels), also provides some guidance on where rates could realistically go. Assuming Bank Rate rises are fully passed through to mortgage borrowers, a rise in Bank Rate to 6.25% would take debt-servicing costs to about 33% – in essence, a debt-servicing burden not seen since the early 1990s boom-and-bust years. Even a Bank Rate rise to 4.5% appears to present a risk of monetary policy overkill (see below).

Household debt servicing costs: actual vs. predicted under different Bank Rate scenarios (% of pre-tax income)

Sources: UK Finance, Office for National Statistics, NatWest Markets

Gilts yields will rise, but the BoE’s intervention doesn’t really affect the medium-term outlook for bonds

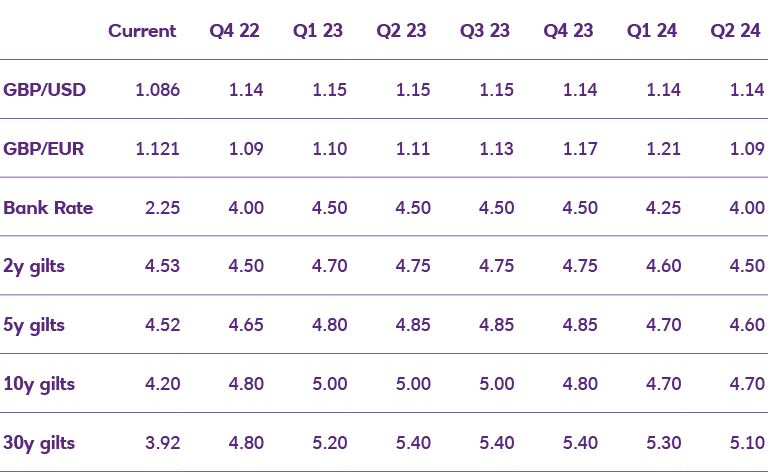
Given the significant growth in the supply of Gilts implied by the mini budget, we don’t think the recent spike in Gilt yields – peaking at just above 4.5% for 10-year notes – was divorced from economic fundamentals: the growth outlook, the path for interest rates, and sterling valuations. And although the swift rise in yields spurred the BoE to essentially restart quantitative easing (QE) in a bid to restore market composure, we don’t think it materially alters the medium-term outlook for Gilt yields (see below).

Key FX, Gilt, and Bank Rate forecasts

Sources: Bank of England (BoE), Bloomberg, NatWest Markets

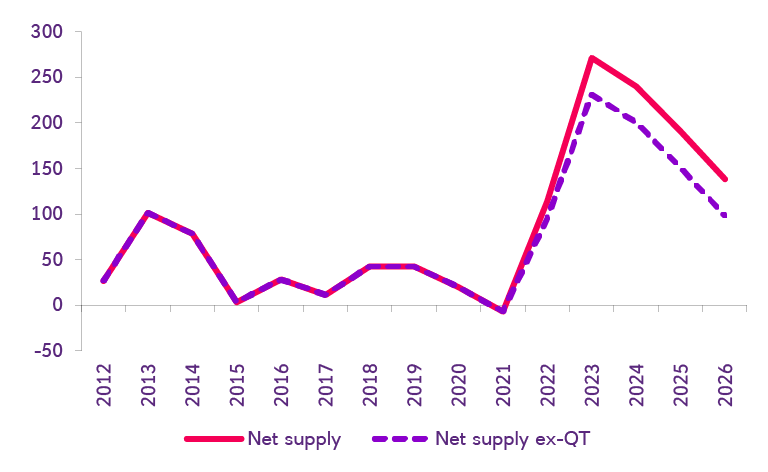
A large part of the re-pricing in yields has been driven by the vast increase in supply of Gilts as a result of the new government fiscal policy. On the other hand, the pace of active Gilt sales through quantitative tightening or QT (around £40 billion) is set to be small in comparison. Even if the BoE were to buy enough bonds in the coming weeks to totally offset the amount of QT over the next twelve months, the net Gilt supply picture is little changed (see below).

Year on year changes in Gilt supply: substantial, with or without active QT (£ billions)

Sources: Bank of England (BoE), UK Debt Management Office, NatWest Markets

Either way, and as we wrote in our previous note, this additional supply is going to struggle to find a home in a high inflation, low growth world. We think that 10-year Gilt yields settling at 5% in the medium-term is more likely than 4%, but the pace of re-pricing to that point may well be more measured than the market moves over the past couple of days.

Get in touch

Speak with your NatWest representative or contact NatWest Corporates.

This material is published by NatWest Group plc (“NatWest Group”), for information purposes only and should not be regarded as providing any specific advice. Recipients should make their own independent evaluation of this information and no action should be taken, solely relying on it. This material should not be reproduced or disclosed without our consent. It is not intended for distribution in any jurisdiction in which this would be prohibited. Whilst this information is believed to be reliable, it has not been independently verified by NatWest Group and NatWest Group makes no representation or warranty (express or implied) of any kind, as regards the accuracy or completeness of this information, nor does it accept any responsibility or liability for any loss or damage arising in any way from any use made of or reliance placed on, this information. Unless otherwise stated, any views, forecasts, or estimates are solely those of NatWest Group, as of this date and are subject to change without notice. Copyright © NatWest Group. All rights reserved.

scroll to top